The Compelling Math of Boring; Or Why We Aim to Minimize Risk
In our internal investment committee meetings, I often refer to our investment process as ‘boring by design.’ John prefers that I use positive words and frowns upon my use of the word ‘boring.’ Let me describe why boring is actually quite a good quality.
It is rumored that Albert Einstein once said, “Compound interest is the eighth wonder of the world. He who understands it, earns it; he who doesn’t, pays it.” While it is doubtful that Einstein actually said these words, it is still worthwhile to take them to heart. In finance, risk is often defined as volatility. Volatility is simply fluctuations around an average rate of return. The higher the volatility of an investment, the wider (and wilder) its swings in price. Consider a choice between two investments: Investment A or Investment B.
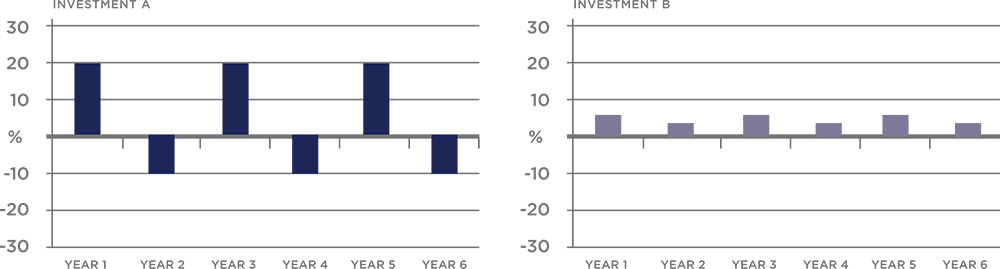
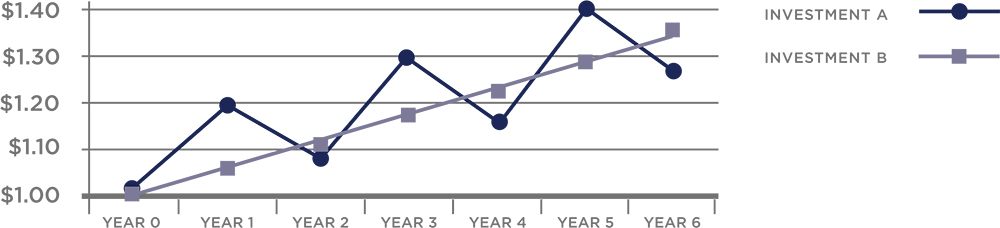
Investment A alternates between returns of 20% and -10%, representing wide variability. Investment B has more consistent returns of 4% and 6%. Both investments have an average return of 5%; however, at the end of the sixth year, Investment A has appreciated by 26%, while Investment B has grown 33%. This is the magic of compounding. And volatility is the enemy of compounding returns.
Our process at Signal Ridge Capital Partners seeks to understand the returns necessary, over time, to successfully fund our client’s lifestyle and goals. Once we’ve determined an adequate rate of return, we try to build a portfolio that minimizes the swings around that targeted return.
Our process serves two purposes. First of all, in difficult times, thoughtfully managing volatility makes it easier to stick to one’s long-term plan. If you are down 10%, you need only an 11% return to get back to even. If you are down 33%, a 50% return is required to get back to even. Massive losses can cause even the most seasoned investors to abandon course at the worst possible time. The second, and equally important, purpose is to enhance the positive effects of compounding by managing volatility.
The arithmetic return is the simple average of returns (Average = (A+B+C)/3). The geometric return is the return that is achieved through compounding. The difference between the two, which can be referred to as the volatility drag, represents the impact of positive versus negative returns when one remains invested and compounds his or her wealth. Without going into too much detail, the formula for approximating volatility drag is as follows:
VOLATILITY DRAG = 0.5 X VOLATILITY2
It is clear from this formula that higher volatility would produce more performance drag.
In the first example above, the geometric return is 3.9% as the wild variations in returns lead to a volatility drag of 1.1%. In the second example, the geometric return is 4.99% meaning that the steady returns produced very little performance drag and a materially higher cumulative return. While the examples above are simplistic, studies have shown that high volatility stocks actually exhibit higher arithmetic returns than the market as a whole. However, their geometric returns are much lower due to the performance drag of volatility.
At Signal Ridge Capital Partners, we would choose the second scenario every time—provided that the expected returns were sufficient—to sustain our client’s objectives. Still, this approach requires patience, as it is quite easy to imagine one being disappointed in the 6% return in year one while a major stock index posts a 20% return in the same period.
Our process is built for the long run, and it requires an understanding of what it is we seek to accomplish. We aim to put you on a path to long-term success that minimizes the bumps in the road so that you can sit back and enjoy the views. Boring produces results. Boring also allows us all to sleep at night.