


Q2 2023 Investment Update
Summary
- The regional bank issues that highlighted Q1 continued into Q2 with the bankruptcy of First Republic Bank
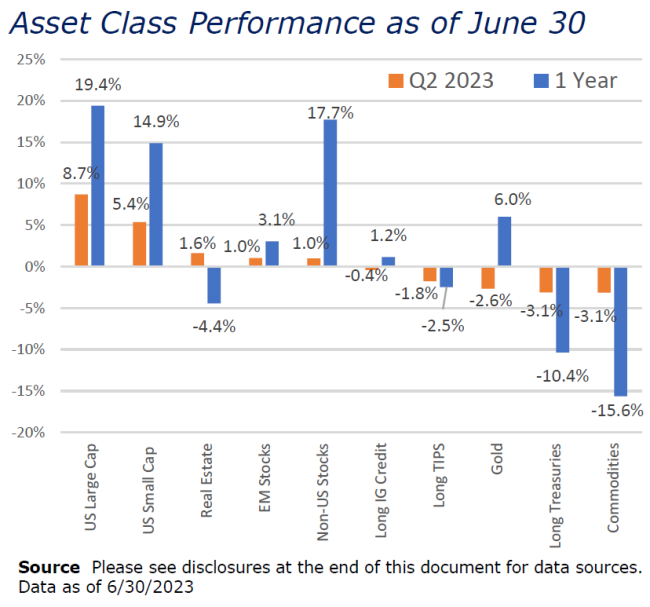
- Equities had a strong quarter, implying in the short-term that these bankruptcies are isolated and contained
- Commodity and bond markets reflected a more pessimistic picture, one of continued sticky inflation, more interest rate hikes and a slowing economy
- The Federal Reserve paused its rate hikes in June for the first time since it began tightening in March 2022. This pause is expected to be short-lived as inflation pressures continue. Trailing 1-year inflation at 4% is well off its 9.1% peak, but still twice the Fed target of 2%
Assessing the Cross Currents
The second quarter began with a continuation of the regional bank stress that surfaced in Q1. On May 1st, First Republic Bank (FRC) became the second largest bank failure in US history surpassing Silicon Valley Bank (SVIB), which had declared bankruptcy just two months prior. JP Morgan agreed to purchase the majority of the remaining assets of FRC, closing the doors on the 38 year-old bank. Interestingly, it was Bear Stearns that failed in March 2008, which was then followed by a couple months of calm, and a 12% rally in the S&P 500. On September 15, 2008, Lehman Brothers declared bankruptcy and stocks fell more than 40% in the months that followed.
To be clear, this economy does not have the same issues that undermined markets during the Great Financial Crisis. However, this year’s 17% rally in the S&P 500 may be overlooking some potential issues that could still be on the horizon. As a global economy, we are dealing with a number of macro and geopolitical cross-currents. Unemployment remains at historic lows and wage growth elevated – typically signs of a strong economy. Conversely, inflation – while falling – continues to be meaningfully above the Federal Reserve’s 2% target. Further tightening is expected despite the Fed’s recent hawkish pause. And per the Institute of International Finance, global debt levels hit a near-record high of $305 trillion in Q1, $45 trillion higher than its pre- pandemic level. High interest rates coupled with high debt levels are typically a bad combination as it puts strain on our ability to pay that debt, leading to greater defaults. Ultimately, that may be one element of what the Fed is looking for in order to get inflation back down to its target.
In the US, we’ve already seen three major bank failures and the iconic Swiss bank, Credit Suisse, failed at the end of Q1. How much more collateral damage is needed before the imbalances are flushed out for this cycle remains to be seen. Central banks are still biased towards fighting inflation while pursuing a soft landing, though some form of a recession is still expected. Stocks rallied during the quarter and appear to be pricing in an optimistic scenario while Treasury bonds and commodities sold off reflecting a more pessimistic view.
An Update on Key Macro Conditions
Global inflation continues to be the key theme driving markets. Specifically in the US, year-over-year inflation continues to come down, albeit at a slow pace. The below graph shows trailing 1-year inflation along with the Fed Funds rate and the 10- year Treasury yield. We’ve shown this data going back to early 2017 to provide enough history to put the environment in context without straying too far from current economic dynamics.
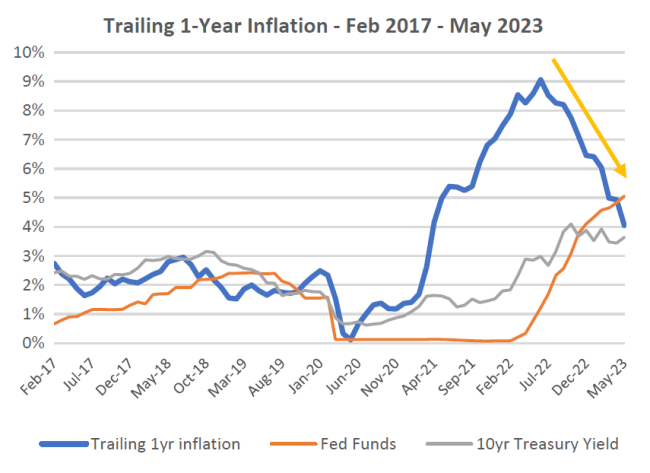
As the chart shows, inflation, short and long-term interest rates stayed in a relatively tight range up to early 2021 – a healthy balance between the three factors. At that point, inflation begins to break out to the upside while the Fed labels this move as “transitory”. The Fed has long since admitted this misread and began to take action in March 2022. Since that date, the Fed has raised its base rate by a total of 5% causing a significant, but still relatively orderly sell-off in financial assets in 2022. The aforementioned bank failures have been the most notable collateral damage during this period and the picture is somewhat clouded by the Russian invasion of Ukraine. However, markets have learned to cope with this geopolitical risk and the Fed hikes appear to be having their desired effect, with more progress to make. That the Fed Funds rate is now above the inflation rate is important as it provides incentive for investors to save and earn an attractive rate on cash. It also disincentivizes consumers to spend on credit as financing rates have risen significantly. Mortgages, car loans, credit card balances – all have become significantly more expensive. While this hurts us as consumers, the expected response should ultimately be a reduction in overall spending, which should continue to help ease inflationary pressures.
Running counter to this trend are unemployment and wage growth. The first chart below shows the unemployment rate for since 1970 from the Bureau of Labor Statistics. The second chart shows the 3-month moving average for wage growth since 1997 from the Federal Reserve Bank of Atlanta.

The average unemployment rate over this period is 5.7%, or roughly 2% higher than it is today. The 3-month moving average for wage increases today sits at 6% vs its average of 3.7% since 1997. These are two key metrics followed closely by the Fed in its continued effort to fight inflation. Of course it is politically unpopular for the Fed to say they want more job losses, but the reality is that would be a positive development towards stabilizing prices, one leg of the Fed’s dual mandate.
The low unemployment rate is closely connected to wage growth. With fewer workers available, companies must be willing to pay new workers more to entice them to leave their current jobs and existing workers more to entice them to stay. This metric peaked in August 2022 at 6.7% and remains well above its historical average.
Why is this happening? There are a range of factors that have contributed to this dynamic, notably continued froth from various stimulus packages as well as deglobalization. On the former, the Supreme Court’s recent ruling to strike down the Biden administration’s student debt forgiveness plan, while unpopular for many, is one measure aimed at counteracting some of this froth. On the latter, as American citizens we generally applaud the onshoring – or reshoring – of jobs because we want to support American workers. Companies such as Intel, Micron and Texas Instruments have proposed plans to produce chips domestically to gain better control over their supply chains. While instinctively a positive for American workers, it puts more strain on an already tight labor force and contributes to stickier inflation.
Net this all together – and consider lessons learned from the inflationary 70’s and 80’s – and we gain a better understanding as to why the Fed continues to remain hawkish and is committed to getting inflation back down to its 2% target. It also helps us better understand some of the “good news is bad news, bad news is good news” reactions we occasionally see in markets currently. When jobless claims unexpectedly fall, stocks and bonds both tend to react negatively because it implies the Fed will continue on its path of raising interest rates. If we see GDP growth fall, that may be a negative for stocks, but positive for bonds as it will be perceived as the rate hikes are having their desired effect of slowing the economy and may be hitting their cycle peak.
The Dollar Cycle
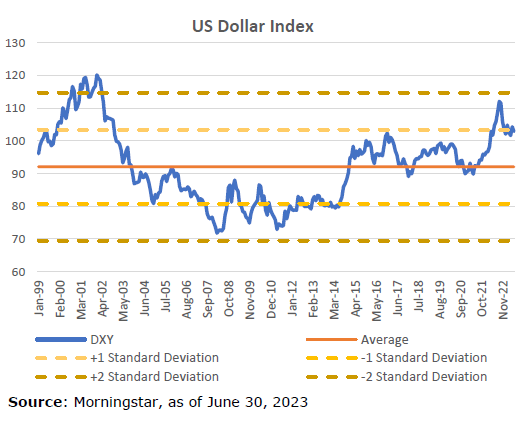
The DXY is a publicly available index that measures the value of the US dollar vs a basket of other currencies. A higher reading on the index indicates that the dollar is strong relative to other currencies such as the euro, Japanese yen and British pound. It is more attractive for US citizens to travel abroad and US companies to import from overseas. The inverse is true when the dollar is weak. From an investment perspective, a weaker dollar has a positive contribution on the value of our non-US investments. The below chart plots the DXY dating back to January 1999. While we have data going back to 1971, we have chosen 1999 to coincide with the inception of the euro, a significant event in currency market history.
The dollar reached its recent cycle high in September 2022, less than a year ago following a long upward trend dating back to the early days of the Great Financial Crisis. Since that time, the trend has begun to reverse.
Many factors go into currency values, such as country interest rate differentials, GDP growth, stock market performance, and government indebtedness, to name a few. The US dollar in particular has benefited from being the world’s reserve currency for many years – i.e. because of the US’s financial leadership for many decades, institutions – both public and private – have chosen to maintain a significant portion of their cash reserves in dollars. These reserves are backed by the full faith and credit of the US government, historically the most creditworthy institution in the world. When crises occur, a ‘flight to quality’ trade often results in foreign currency exchanges back to dollars causing a spike in dollar strength.
Even with this recent move down from its cycle peak, the dollar remains overvalued relative to its more recent history. When we consider the high level of debt in the US and an inflation issue that has the Fed committed to slowing the economy, it begs the question of whether we may be looking at a cyclical, or potentially even secular, decline in the dollar. From a portfolio perspective, we are happy to have meaningful non-US exposures as both valuable diversification and a potential tailwind in the medium-term.
Looking Forward
The data continues to point to this being a particularly tenuous time in our economic history. There is no shortage of conditions to be concerned about, particularly when we layer in tensions between Russia and the Ukraine and its western allies, the US and China, and China and Taiwan. The US election that will take place in 2024 projects to be as divisive to our country as the last and increased violence within our country with a politically charged undercurrent has become commonplace. However, the economy and markets when viewed over the course of decades have proven their worth while overcoming a range of adverse conditions along the way.
And while Signal Ridge continues to assess the many risks that have the ability to negatively affect financial markets, we stand strong in our commitment to building highly diversified portfolios with the goal of growing our clients’ wealth more consistently over time.
Important Disclosures and Data Sources
- US Large Cap stocks – S&P 500 Index; Standard & Poor’s
- US Small Cap stocks – Vanguard Small-Cap Index Fund ETF, which seeks to track the performance of the CRSP US Small Cap Index that measures the investment return of small-capitalization stocks
- Non-US stocks – iShares Core MSCI EAFE ETF, which seeks to track the investment results of the MSCI EAFE IMI Index composed of large-, mid- and small-capitalization developed market equities, excluding the U.S. and Canada
- Emerging Market stocks – iShares Core MSCI Emerging Markets ETF, which seeks to track the investment results of the MSCI Emerging Markets Investable Market Index
- Real Estate – real estate returns are represented by the FTSE Nareit U.S. Real Estate Total Return Index Series
- Long Duration Investment Grade Credit – Vanguard Long-Term Corporate Bond Index Fund ETF, which seeks to track the performance of the Bloomberg U.S. 10+ Year Corporate Bond Index
- Long Duration US Treasuries – iShares 20+ Year Treasury Bond ETF, which seeks to track the investment results of the ICE U.S. Treasury 20+ Year Bond Index (the "underlying index")
- Long Duration US TIPS – PIMCO 15+ Year U.S. TIPS Index Exchange-Traded Fund, which seeks to provide total return that closely corresponds, before fees and expenses, to the total return of the ICE BofA 15+ Year US Inflation-Linked Treasury Index
- Gold – World Gold Council, https://www.gold.org/goldhub/data/gold-prices
- Commodities – iShares S&P GSCI Commodity-Indexed Trust, which seeks to track the results of a fully collateralized investment in futures contracts on the S&P GSCI Total Return Index
Important Disclosures
This Update describes how a representative Signal Ridge portfolio is positioned in the current markets environment and how we think about building portfolios more broadly. Individual client performance can and will vary based on each clients’ unique circumstances and individual risk tolerances.
Past performance does not guarantee future results. It is not possible to invest in an index. Individual account performance may vary based on inception date of the account, timing of rebalancing, trade execution prices, timing of cash flows, fees, taxes and other potential factors. All views and opinions expressed in this letter are solely those of Signal Ridge Capital Partners, are subject to change at any time without notice, and are not a recommendation to buy or sell any securities.
Signal Ridge Capital Partners is registered investment adviser, CRD No. 167576